Myinfomonitor – Visualize operational data in the most impactful way
  • Home
  • Careers
  • Contact
    • Media Bank
  • Support
    • Support for DS >
      • Tutorials
      • User Guide DS
      • RMA

This is How it Works

The dashboard Illustrator allows you to visualize things in the most concrete way. Loaded with stencils and easy-to-use visualization logic editor.
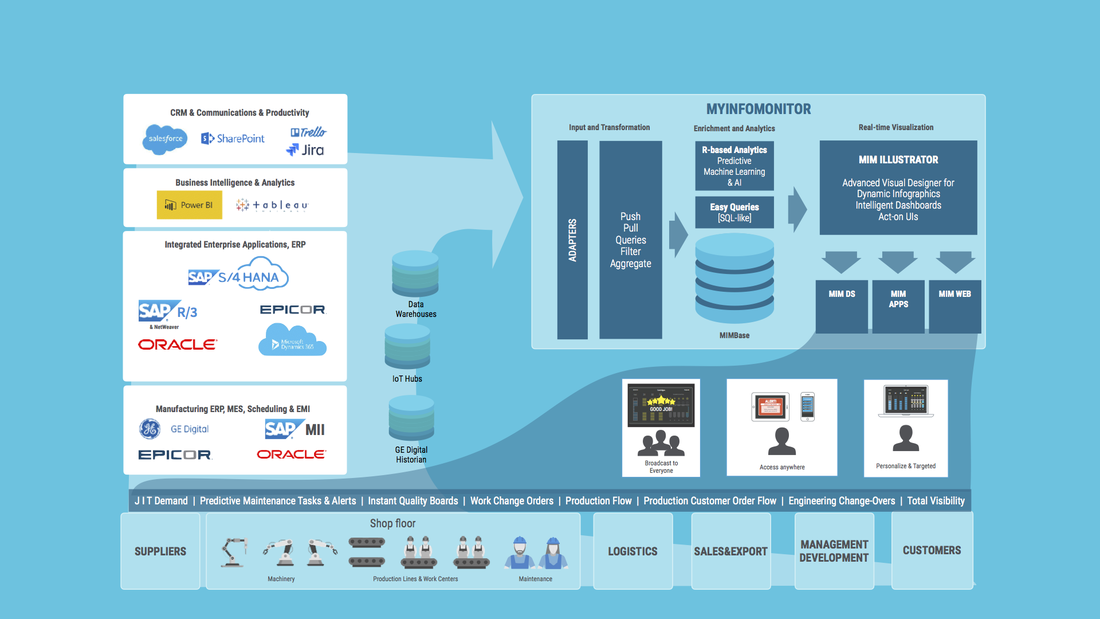
Myinfomonitor (MIM) collects data from all manufacturing data sources and converts them into instant actionable insights, warnings and tasks. 
Picture
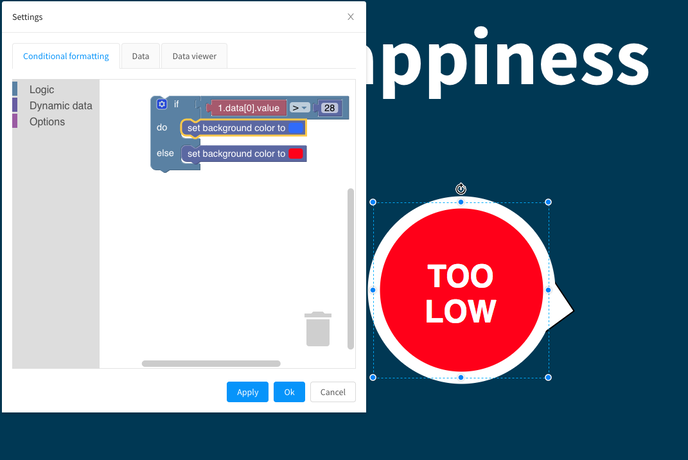
Easy to use, quick to deliver. In just a few minutes you can have for example preventive alarms visible throughout your organization.

Examples of things you can do with Myinfomonitor Illustrator

  • Show values as visual warnings
  • Display tasks assigned to people  instead of just data that a human needs to understand means something needs to be done
  • Convert values to text or visual signs
  • Have ranges or certain logic make visuals   appearing or  disappear
  • Trigger the whole dashboard to change when something really important    needs attention
  • Create advanced logic for your visualization shapes and transform them into actionable cues easily without coding
  • Collect data from any source or save data into Myinfomonitor through our API without long and expensive integration projects.
Need more?
  • There is a place and good uses for charts: MIM Illustrator includes a comprehensive charting tool with support for dozens of chart types
Need even more?
  • Use D3.js visualization library to configure or even code  any type of custom visualization
  • You can also create fully custom stencils with REACT, it's still easy and you will have all connected data sources and variables available


Seamless Integration with ERP, BI, AI and IIoT Platforms

MIM has a state-of-the-art integration & data collection engine that requires no coding from the source system side. Our systems were specifically-designed to tap into hundreds of varied systems.
Also, you can write data into MIM with little effort through our API


Advance and Real-time Architecture

Automate data flow and visualization. Reporting or slow analytics will not do the job for fast-paced decisions, work management or preventive alerts and monitoring. The core of our infrastructure is super-fast, aggregate, plug other systems very quickly and make your visualizations live in an instant. 
Picture
Give your entire production network the information it needs to execute more efficiently. Our easy-to-understand visual dashboards give your personnel the information they need to stay informed, remove the guesswork from planning, and stay agile.

Our system is designed to work at the office, on factory floors or to create impactful control rooms and command centers. Whatever the size of your operation, we help your team understand what needs to be done - the first time right.
Pre register for a free trial
Contact Sales and Start Today

Call us: +358 10 470 2670

Contact Us

Quick links

  • Contact
  • Support
  • Tutorials & Tricks
  • Privacy Policy
  • ​Cookie Policy
  • ​Term of Service​

In Finnish

 Myinfomonitor Infonäyttöratkaisut: Infonäytöt ja digital signage

Company

Myinfomonitor (incorporated) – 
Address: Rautatienkatu 21 B | 33100 Tampere Finland
contact@myinfomonitor.com |  +358 10 470 2670  
Business ID FI1985506-8

Myinfomonitor is part of SpectrumOne Group
​
  • Home
  • Careers
  • Contact
    • Media Bank
  • Support
    • Support for DS >
      • Tutorials
      • User Guide DS
      • RMA